Mid-sized business and barriers to growth

Australia’s business profile is one of hundreds of thousands of small businesses, tens of thousands of mid-sized businesses and thousands of large businesses. It is well established that the larger the business the more likely it is to innovate and export, be digitally active and have higher productivity levels than smaller businesses. Larger businesses also employ more high skilled workers and capable managers, and pay them higher wages. We could, ostensibly, lift Australian productivity and wages just by having more mid-sized and large businesses. If only it were that easy!
This opening raises two fundamental questions for consideration at this summit. First, does Australia have too few mid-sized and large businesses? Second, what barriers inhibit their growth? These two questions have been the focus of the work-to-date of the Mid Enterprise Advisory established by Global Access Partners last year.
The highly skewed pattern of businesses by size is so persistent over time and across countries that we tend to take it as immutable. Economists suggest that it arises from three underlying drivers: the ease of entry, the ease of imitation, and a selection sorting effect.
Ease of entry refers to how difficult or costly it is for new businesses to enter an industry. The easier entry is, the greater the check that puts on market concentration among incumbent businesses.
Ease of imitation refers to the ability of an individual business to grow by mimicking the success of others. There may be technologies or organisational processes that give some businesses a competitive edge, and which are easily replicable. The more difficult or costly it is to mimic these, the harder it is for businesses to grow. For example, patents can dampen uptake of new technologies, and regulations that are size-specific or narrow competition might be a barrier to growth. Ease of imitation diffuses innovation across the economy to the benefit of consumers through lower prices and higher productivity.
The selection effect is one whereby the most capable business owners and managers gravitate towards growing businesses. The best managers end up in the best run, typically larger, businesses.
I will now examine the evidence for all three of these drivers, but first present some basic statistics on the business size distribution.
The most common way of categorizing businesses by size is how many people they employ. This is probably a superior measure than turnover, as that can be distorted in industries with high input costs. Governments use both measures in tax and regulatory settings. For example, payroll tax exemptions are typically defined by employment thresholds (with reference to the wage bill) while the recent company tax cut uses a revenue threshold. For the sake of simplicity I use employment levels as a means of discussing business size.
The ABS reckons there to be 2.2 million economically active businesses trading in Australia as at June 2016. Of these, approximately 1.3 million are run by people working on their own account with no employees, 599,000 are micro-businesses with 1–4 employees, 199,000 are small businesses with 5–19 employees, and 51,000 are mid-sized businesses with 20–199 employees. That leaves just 4,000 large businesses with 200 employees or more. Now, of course, these numbers do not correspond to the respective economic contributions of the businesses in those different size classifications. For example, the mid-sized businesses account for 2 per cent of all businesses, but 23 per cent of all employment.
Exhibit 1: Business counts and employment share, by business size
Business counts and employment shares by size
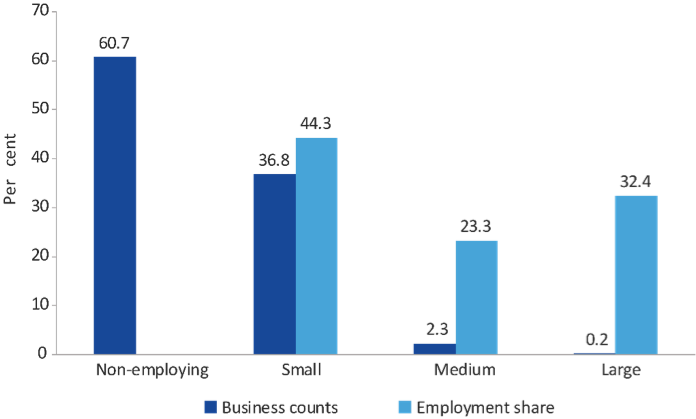
Notes: The employment share of small businesses from ABS cat. No. 8155.0 includes non-employing businesses
Source: ABS cat. no. 8165.0, table 13, and ABS cat. no. 8155.0, table 05, June 2016
An implicit premise of this summit is that Australia has too few larger businesses. One way of testing that is to look at the number of mid-sized and large businesses proportional to our population and compare that against other countries. Here is an important finding: relative to the OECD average, Australia has slightly more mid-sized businesses than our population size would suggest. There are 1,700 mid-sized businesses in Australia per million people compared with an average of 1,440 per million people across the OECD Countries with a significant over-representation of mid-sized businesses are Germany — as one might expect given its strong focus on the Mittlestand — and Canada, possibly reflecting its proximity to major markets in the United States.
Analysis undertaken by the Office of the Chief Economist, with data sourced from the OECD SBDS Structural Business Statistics (ISIC Rev.4) Database and Penn World Tables — Business counts reported by the OECD are similar but not identical to those reported by the ABS due to differences in methodology and scope.
Exhibit 2: Medium-sized businesses per million people in OECD countries
Medium business counts by population — OECD
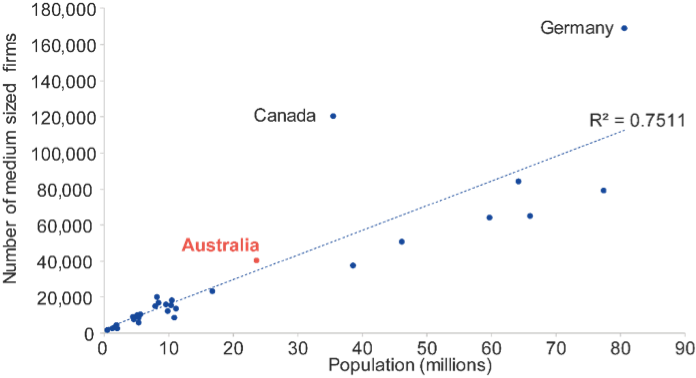
Source: OECD SBDS Structural Business Statistics (ISIC Rev.4) Database and Penn World Tables — 2014 or most recent year available
Extending this analysis across all business sizes it transpires that Australia has more businesses overall per million people than is found across OECD countries, markedly so for small businesses.
What might account for that? I will answer that question with reference to the framework I have outlined: the ease of entry, the ease of imitation, and selection effects.
The ABS estimates that 310,000 new businesses began trading in Australia during the 2015–16 financial year, a record high. Each year the World Bank publishes a cross-country report on Doing Business. The report consistently rates Australia as a country where it is comparatively easy to start a business. Australia ranked 7th in the world in 2017, with quite modest differences between it and New Zealand, the number one country, in procedures to observe and costs to meet.
While ease of entry appears to be true in general for Australia, there are substantial differences across industries reflecting barriers to entry. For instance there were just 15 start-ups in banking and 7 new department stores in 2015–16, compared with nearly 9,000 new cafes and restaurants.
Bernard Salt points out that all of the top ten businesses on the Australian Stock Exchange were founded before 1970, while in the United States half of the top ten have been founded since 1975. Andrew Leigh and Adam Triggs find that the four largest businesses in each of the 461 industries in Australia account on average for 36 per cent of revenue in their industry, an indication of high market concentration. There are several industries, well known to consumers — supermarkets, banks, health insurance providers, and domestic airlines among them — where the market concentration of the four largest businesses exceeds 80 per cent.
Plainly, it can be hard for small and mid-sized businesses to mimic the success of these large players. An independent suburban supermarket is, to all intents and purposes, growth constrained by the size of its local market, let alone not having the scale to adopt the sophisticated supply chain and operational logistics of the major supermarket chains.
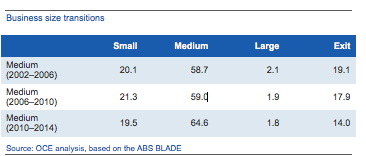
The ease of imitation can be estimated by looking at the transition rates from one size category to another. We do this using BLADE, the longitudinal database of all businesses in Australia, a joint endeavour between the Department of Industry, Innovation and Science and the ABS. The key finding is that most mid-sized businesses stay mid-sized. Post the Global Financial Crisis around two in three persisted as mid-sized between 2010 and 2014.
Turning to those that did make a transition, here the data is sobering. Businesses in this group are about 10 times more likely to shrink back to small than they are to grow to become a large business. If those who exited business altogether are counted, the ratio of shrinkers to growers increases to roughly 20:1.
Exhibit 3: Business size transitions
Selection effects can be expected to result in differences in management capability across businesses of different sizes. A fortnight ago the ABS published headline results from the Australian Management Capability.
Survey, the first time that official statistics have been collected on this topic. The survey was funded by the Department of Industry, Innovation and Science and covered close to 15,000 private sector businesses across all industries and all sizes. The findings are stark:
- Only one in ten businesses had a written strategic plan in place, rising to around a third for all mid-sized businesses.
- Half of all businesses did not monitor any aspect of their performance. Among mid-sized businesses four in five monitored one or more aspect of performance. Of those that did, nine in ten tracked revenue, two in three indicators of quality, and just one in four innovations in the business.
- Just over one in ten businesses agreed that they embarked on high risk and high reward ventures in their business, rising to one in five mid-sized businesses.
- A third of the principal managers had a degree or higher, a share no different to that in the workforce at large. This is 20 years after the Karpin Report argued that the skill profile of Australia’s business managers was inadequate.
The conclusion to be drawn from this brief survey of the evidence is that the business profile of the Australian economy can be characterised as one with high ease of entry that encourages the emergence of many businesses, but also one with high costs of imitation and strong selection sorting effects that in combination act to constrain the growth of small and mid-sized businesses.
Many business owners have no aspiration to grow. This may very well be true for the bulk of people working on their own account, and those in micro-businesses. But mid-sized businesses are not born so: they have grown to mid-sized respectability. What is holding them back from growing further? When the principal business manager is asked this question, it is striking how different the responses are for mid-sized compared to large businesses. For all businesses, irrespective of size, the biggest constraint they faced was low profit margins. Managers of mid-sized businesses, however, were much more likely than those in large businesses to report difficulties sourcing workforce talent, problems with cash flow and with access to finance — all of these point to problems in ease of imitation.
Exhibit 4: Barriers to performance
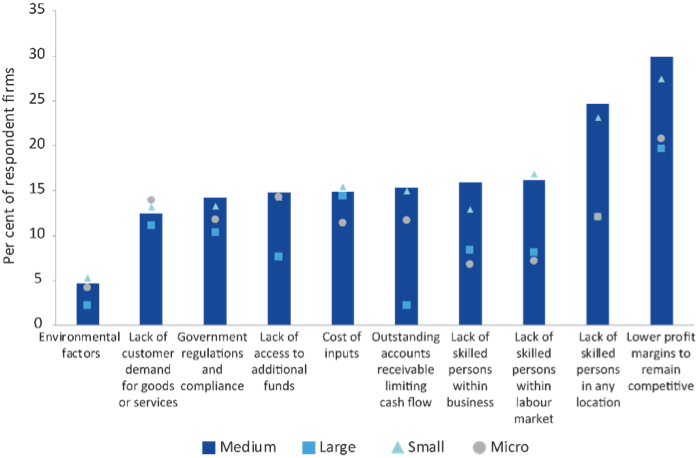
Source: ABS Business Characteristics Survey, cat. no. 8167.0, table 01, 2015–16
Government regulations and compliance were reported as a barrier to growth by 14 per cent of mid-sized businesses and 10 per cent of large businesses in the most recent Business Characteristics Survey. Regulation is known to affect businesses of different size in two ways. First, due to scale effects, businesses of a smaller size incur proportionally higher costs in complying with regulation — they simply can’t afford to employ specialist staff to professionally deal with these issues.
In a federation like Australia this can be magnified for businesses that want to mount operations in more than one State as many State regulations are not harmonised. Second, there are a range of regulations that are conditional or vary in their application by business size like payroll tax exemptions. Similarly, there are some benefits available to small businesses that peter out beyond a certain size threshold, such as certain company tax benefits. While these benefits and regulatory exemptions compensate small businesses for the higher regulatory burden they face, they can, if not checked, act as an impediment to growth. A recent French study found a sizeable cluster of businesses with 49 employees who “chose” not to become any larger so as to avoid coming into scope for a range of regulations applying to businesses with 50 employees or more.
Among mid-sized businesses there is a refrain that they are too large to benefit from the range of government support provided to small business, but not large enough to hold sway when government seeks industry input on changes to regulations and policy settings, thus leaving them doubly disadvantaged. It is the case though that mid-sized businesses are more likely than small businesses to participate in government programs like the Entrepreneurs’ Programme and to access the R&D Tax Incentive.
Many businesses are content to remain operating just as they are. But there are also many businesses that enter and disrupt markets and thrive. In Australia well-known examples include Atlassian, Seek and Red Balloon. The
forthcoming Australian Innovation System Report examines the phenomenon of businesses like these, known as high growth firms. Our work finds that these businesses make a highly disproportionate contribution to employment and turnover growth in Australia and that mid-sized businesses make up the largest sub-set of high growth firms relative to their share in the population. They are found across all industries.
Where does this leave us? On the one hand there is no shortfall of mid-sized businesses in Australia and there are plenty of examples of trailblazing high growth firms; on the other, management capability looks to be below par and the transition rates from mid-sized to large businesses are extremely low.
The Mid-sized Enterprise Advisory is posing the question at this summit whether Australia needs a dedicated national mid-sized growth strategy. Among the starting points for a strategy would be examining regulatory and competition settings and the extent to which they unduly benefit large businesses, as well as ways of nurturing the potential of small and mid-sized businesses with growth ambitions. One strategy element we have been actively considering is a Growth Institute that targets its advice and services towards mid-sized businesses. We welcome input from summit participants during the day on the merits of a national mid-sized growth strategy and a Growth Institute.
References
Gabaix X. (2016), ‘Power Laws in Economics: an Introduction’, Journal of Economic Perspectives, Vol. 30, No. 1, pp. 185–206.
Garicano L., Lelarge C. and Van Reenen J. (2016), ‘Firm Size Distortions and the Productivity Distribution: Evidence from France’, Centre for Economic Performance Discussion Paper 1128, London School of Economics.
Karpin G. (1995), Enterprising Nation: Renewing Australia’s Managers to Meet the Challenges of the Asia-Pacific Century, Australian Government Publishing Service, Canberra.
Leigh A. and Triggs A. (2016), ‘Markets, Monopolies and Moguls: The Relationship between Inequality and Competition’, Australian Economic Review, Vol. 49, No. 4, pp. 389–412.
Lucas, R. (1978), ‘On the Size Distribution of Business Firms’, Bell Journal of Economics, Vol. 9, No. 2, pp. 508–523.
Luttmer, E. (2007), ‘Selection, Growth and the Size Distribution of Firms’, Quarterly Journal of Economics, Vol. 122, No. 3, pp. 1103–1144.
Mark Cully became Chief Economist in the Department of Industry in September 2012. He has enjoyed a varied career in applied economic research at the intersection of government and academia.